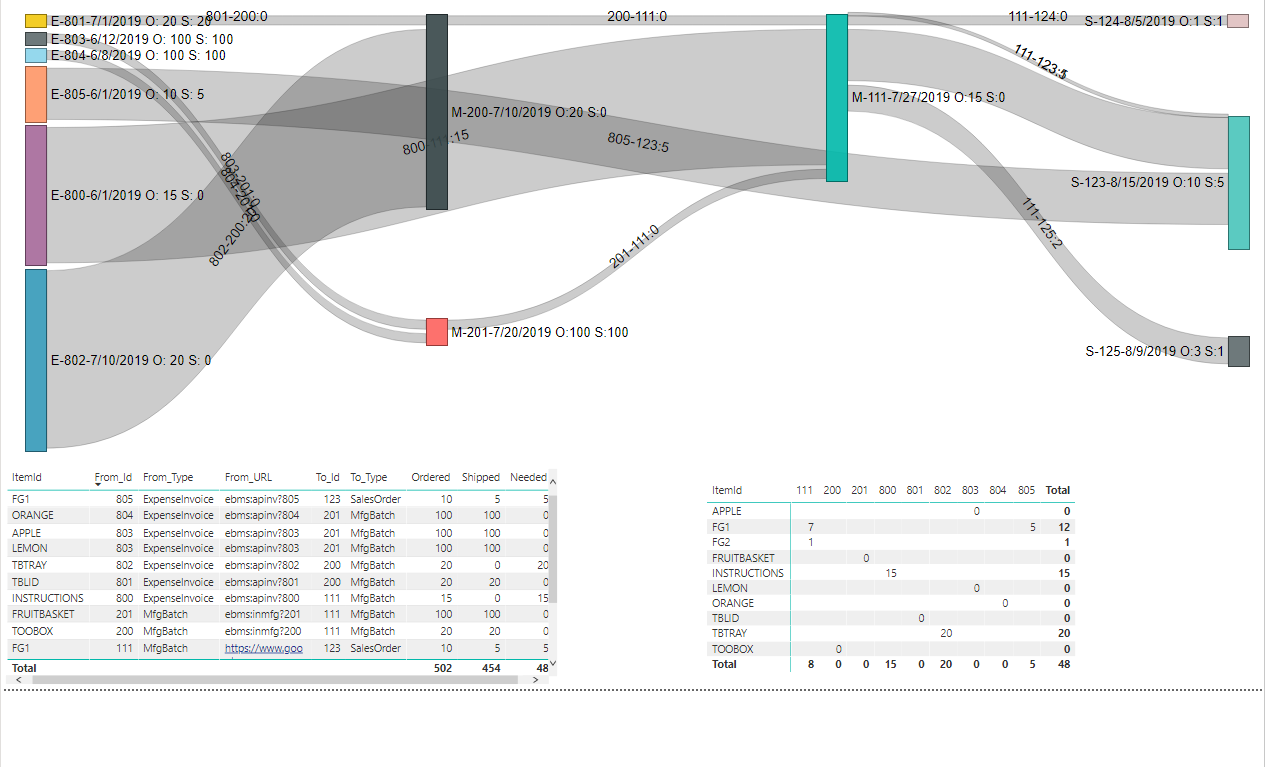
A visual Power BI chart is an effective way to display a snap shot of the multiple step manufacturing process between the parts or raw materials to the sales orders or stock requests.
The Sankey diagram links the following EBMS documents:
A sankey diagram business intelegence report requires SQL Mirror and a business intelegence tool to create a Sankey Diagram. Review [Main] Technical > SQL Mirror and Power BI Overview for details on these advanced EBMS tool options.