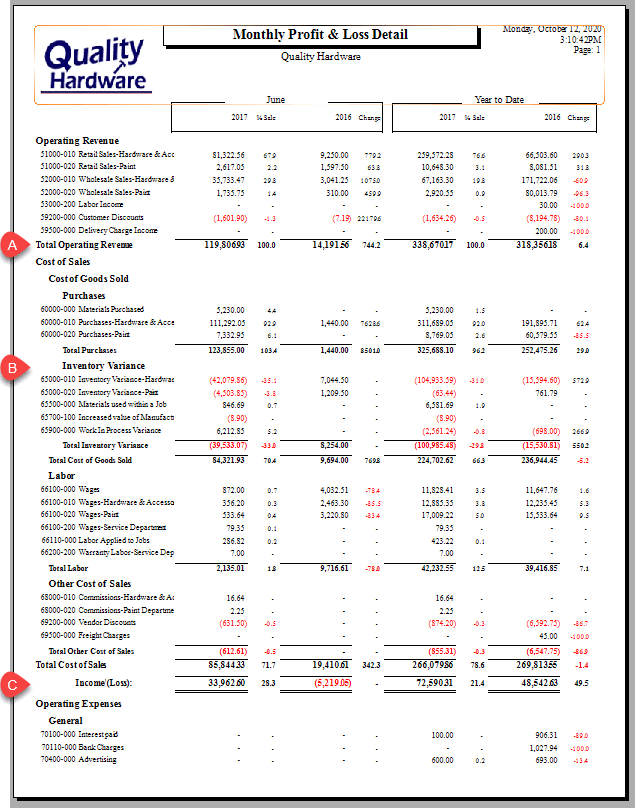
The profit and loss (P&L) statement is a financial statement that summarizes the revenues, cost of goods sold (COGS), and administrative expenses and overhead incurred during a specified period. The P&L statement is synonymous with an income statement. These reports report the profits or losses during the reporting periods including both the total revenue (A), gross profit (C), and net profit (D). Review the example report below for example profit values. The profitability of a company, department, or profit center is determined using a profit and loss statement. The Gross The variety of P&L statements included in EBMS allow the user to compare monthly, quarterly, or annual profits for a given profit center. These important reports will give a manager the tools required to make management decisions based on profit trends for a given time period or profit center.
The financial account grouping and labels are determined by the configuration of the chart of accounts. Review Chart of Accounts > Folders for more details on configuration of groups or changing labels.
This popular P&L report is used to evaluate both the monthly and year-to-date profit summaries.

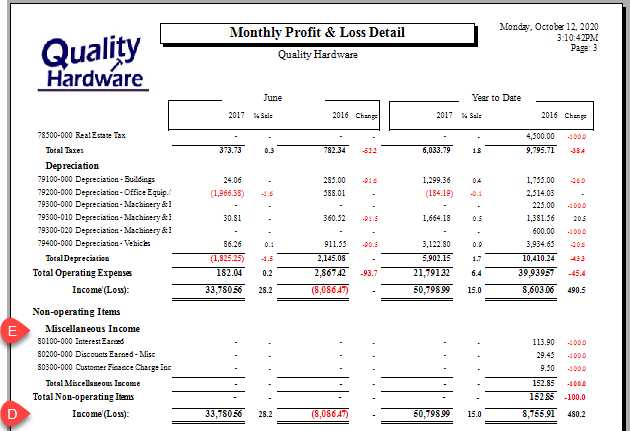
Total revenue for the given period. Note that miscellaneous income (E) may appear at the end of the report as non-operating revenue.
The inventory variance section is used to adjust the purchase totals to calculate the total cost of goods sold. This section can be eliminated by combining the inventory value change with the total purchases. Review [Inventory] Tracking Counts > Inventory Variance for more details on the optional section within the profit and loss statement.
The Income (Loss) line following the cost of sales section identifies the gross profit of the company or profit center. This important value reports profits without the administrative or overhead costs.
The net profit is displayed at the end of the P&L statement includes the company expenses to report a complete profit picture within the given time period. See the following example of the last page of the profit and loss statement.
Last page of the same report:
Most P&L statements contain multiple period comparisons. Open these reports by selecting from the main EBMS menu and then opening as shown below:
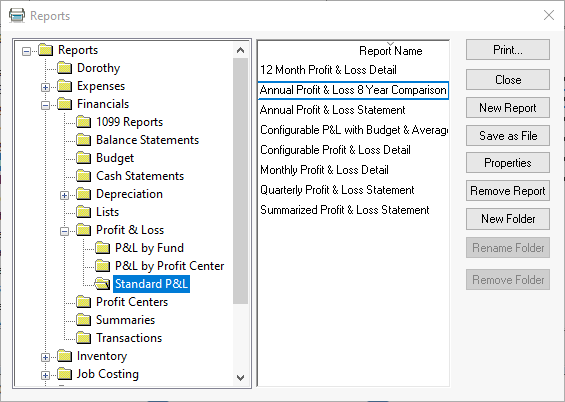
The Standard P&L group is the most common group of reports. The P&L by Fund group is designed for nonprofit organizations. Review the following section for profit center P&L option details.
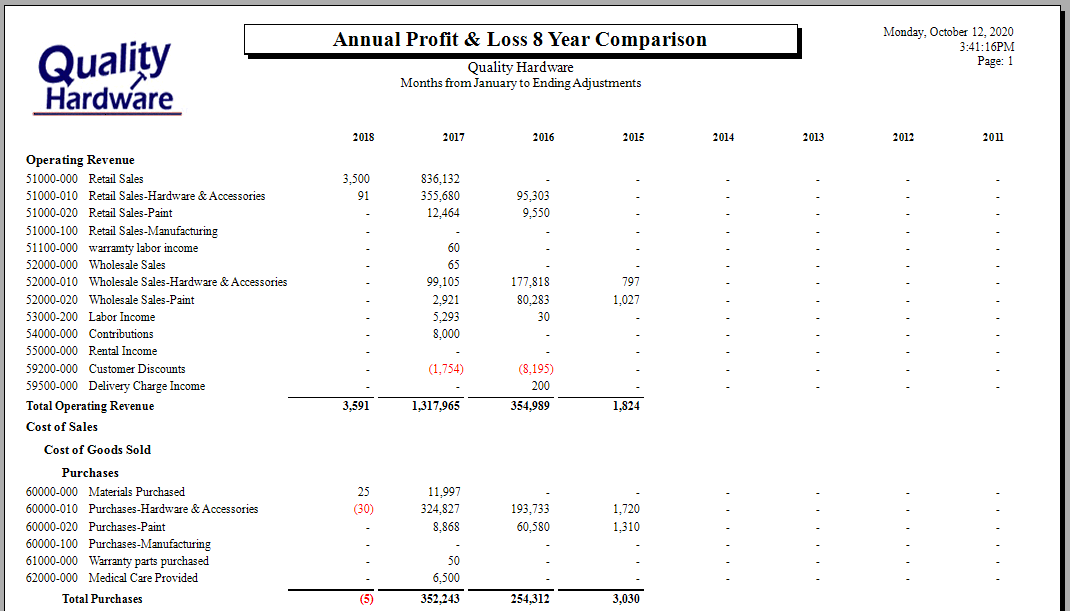
The following 8 year comparison are useful to review trends over a multiple year period.
An effective way to evaluate profits within a company is to generate profit and loss reports per profit center, division, or department. Open these reports by selecting from the main EBMS menu and then opening as shown below:
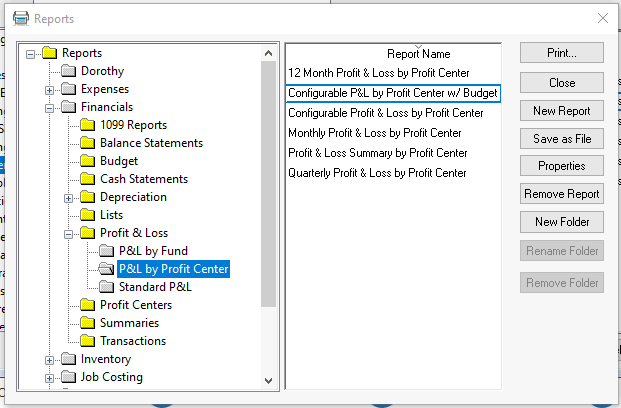
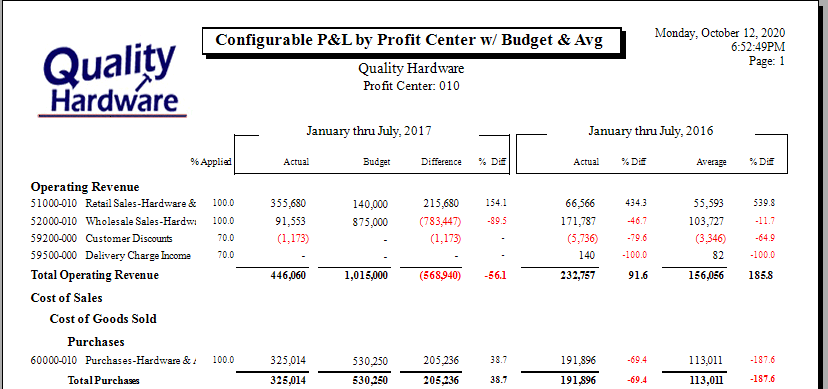
The Configurable P&L by Proft Center w/Budget report contains various columns and allows the user to custom define the monthly range period.
The Profit & Loss Summary by Profit Center is a great report for a simple one page summary of the profits for each profit center.
