Optimizing stock levels can be especially challenging if products vary dramatically based on the time of the year or if the life cycles of the products vary substantially. The advanced inventory management tools incorporate some of today's most advanced inventory management methods. The Advanced Inventory Management module will calculate sales projections based on sales history.
Benefits of this utility:
Reduce the total amount of inventory without losing sales by predicting the proper inventory levels more accurately
Let the EBMS System determine inventory levels rather than manually entering minimum and maximum inventory amounts. This tool uses advanced formulas to calculate Predicted Sales for future months based on past year's sales history.
This utility applies only to items with the following criteria:
Must be classified as Track Count or other perpetual inventory classification. Items classified as No Count, Service, and other none inventory items will be ignored.
Must have a Purchase Method of Stocked. Special orders etc are ignored by this utility.
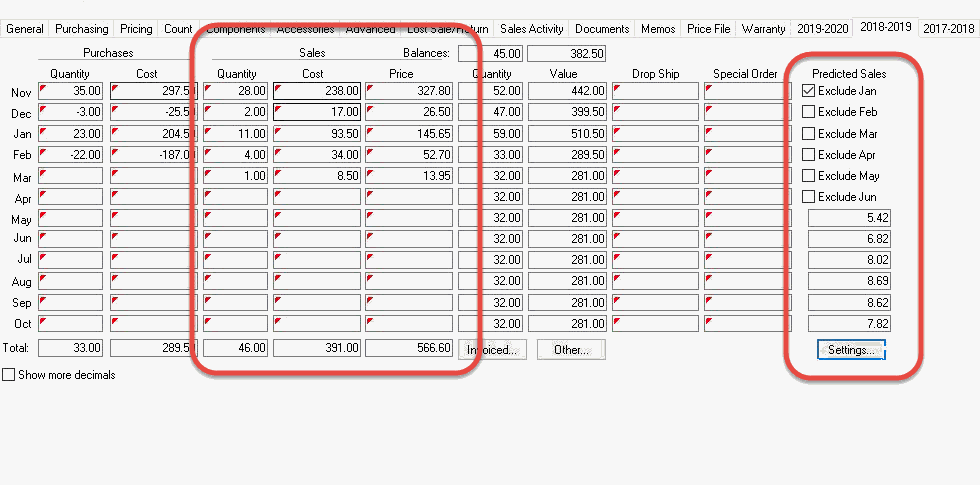
This information can be viewed within a applicable product item's history
tab as shown below:

An option to exclude any past month's sales history can be enabled to ignore the sales for the selection month. All future months will contact a sales projection value as shown above.
The sales projection utility contains the ability to use one of the following prediction types based on sales history:
Average: Minimum and maximum values are calculated based on the sales history averages. This method should be used if sales do not change considerably based on the time of the year.
Linear: Sales are steadily increasing or decreasing in a linear fashion. If the sales history indicates that sales continue to increase, the projected stock level values would be increased accordingly. The same linear method would be used if sales are steadily decreasing.
Seasonal: Sales fluctuations are evaluated based on the time of the year. This option will adjust stock level values according to the sales demand during past years. This setting becomes more accurate as sales history expands to multiple years. This prediction type should not be used until a substantial amount of history is accumulated.
Restricted time period: The Automated Ordering utility can restrict the formulas to be limited to a range of months (less than the entire year). This month range has a similar effect as the Seasonal setting. For example, the user may wish to evaluate the sales history to a November through April time period completely ignoring months May through October. More details listed in Automated dialog instructions listed below.
Best Fit: The advanced inventory utility can be set to try to determine which of the prediction types listed above best fits a particular inventory item.
Complete the following steps to set the Predicted Sales value for future months.
Open an inventory product record and click on the product history year tab as shown above:
Select a Warehouse if inventory is managed in multiple locations. Note: a warehouse must be selected to enable the Settings button as identified with the red arrow in the previous image.
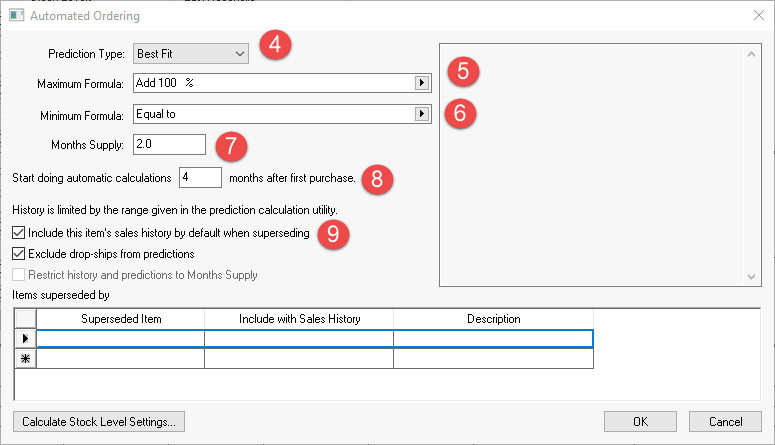
Click on the Settings button to open the following
dialog:

Select one of the following Prediction Type settings:
No Prediction - Select this option to disable the automatically setting and manually set the minimum and maximum values. This option disables the automated feature.
Best Fit - (Recommended) By selecting this option, the system determines the best Prediction Type based on sales history. The system will try to predict the amount of sales for the past 6 months using each one of the models listed above. The prediction results for each type is compared to the actual sales in the past period to determine the best fit. The Best Fit option should be used unless the user wishes to restrict the automated calculation process.
Seasonal - Use this
option for seasonal items. This option will adjust minimums and
maximums when sales fluctuate based on the time of the year. The
seasonal prediction type should not be selected until a substantial
amount of history is accumulated. Use the Best
Fit option for Seasonal
items until multiple years of history is recorded.
An alternative seasonal method is to set the Prediction
Type to either of the following types (Linear
or Average) and
use the Automated Ordering utility
to restrict the formulas to be limited to a range of months (less
than the entire year). This month range has a similar
effect as the Seasonal setting.
For example, the user may wish to evaluate the sales
history to a November through April time period completely ignoring
months May through October. NOTE: Running this utility
does NOT erase the existing month projections for the months excluded
from the range of months.
Linear - Use this option if the sale of item tends to increase or decrease in a linear fashion. This method should be used when items increase or decrease in a consistent manner and do not fluctuate in a seasonal manner.
Average - Select this option if sales are somewhat consistent during the sales life of the product. This method calculates the minimum and maximum values based on the average sales in history. This prediction type is not as dependant on substantial history as the Seasonal type.
Set the Maximum Formula setting by selecting a formula from the drop down options and setting the appropriate values. In the example above the Maximum stock level = 2 months sales projections *100% (double the amount sold in 2 months)
Set Minimum Formula settings by selecting the formula and entering any necessary values. In the example above the Minimum stock level quantity = 2 months sales projections.
Enter the Months Supply value: This value is based on the projected sales for the next number of months. In the example above, the formulas will use 2 months as a projection range.
The Start doing automatic calculations setting should be set to delay the Automated Ordering process to a specified amount of time after the first purchase. This value can be set to zero if the process should not be delayed. NOTE: This value must be less than the period of time used for the calculation process described below. NOTE: The projection will be ignored completely if the Start Doing Automatic Calculations is greater than the range of time used for projections.
Enable the Include
the items sales history by default when superseding to include
the sales history or superseded items listed at the bottom of the
dialog.

Enable the Exclude drop shipments from predictions to exclude any sales that were dropped shipped from the vendor instead of selling from stock. Review the Drop Ship Purchase Method documentation for details.
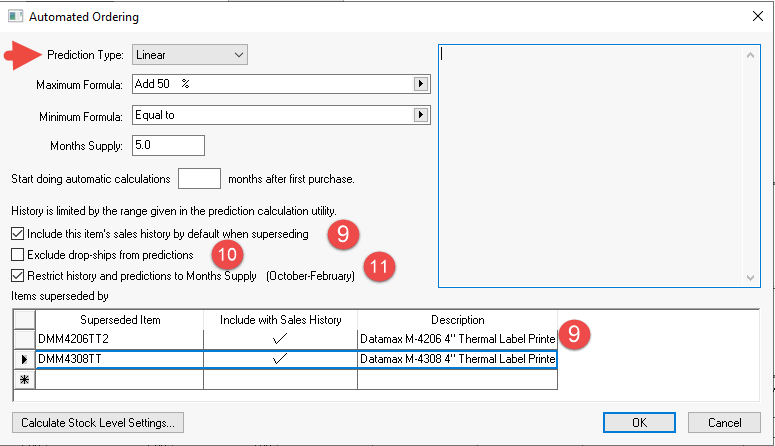
Enable the Restrict history and predictions to Months Supply option to ignore sales outside a determined time frame for seasonal items. This approach makes the following assumptions:
The item is seasonal within the number of months identified by the Months Supply value.
Purchasing is done on an annual basis to prepare for sales within a limited range of months.
The Minimum and Maximum stock level settings contain the stock levels needed for the specified season within a year.
The process to restrict history and predictions to a range of months requires the following:
The Prediction Type must be set to Liner or Average.
Enable the Restrict history and predictions to Months Supply option
Click on the Calculate Stock Level Settings to calculate settings for current inventory items. mReview
The Prediction Type, Maximum Formula, Minimum Formula, and Months Supply can be set for an entire group of products by completing the following steps:
Open the folder defaults by clicking on the Edit Defaults button within the Inventory > Options > Inventory Folders tab.
Click on the Count tab and click on the Automated button.
Set the desired settings for the group. Review the steps above for setting details.
Right-click on each setting and select Filter
Down.

The Filter Down option must be repeated for each setting. Review the Features > Change Defaults, Filter Down Data and Globally Change Data section of the main documentation for more details on filtering down defaults for an entire group.